![]() 2024 HDR Scholarship: Curtin-Orthopaedic Research Foundation WA - Apply now
2024 HDR Scholarship: Curtin-Orthopaedic Research Foundation WA - Apply now
Corrosion research at the macro-, micro-, and nano-scales
John de Laeter Centre Facilities for Corrosion Research
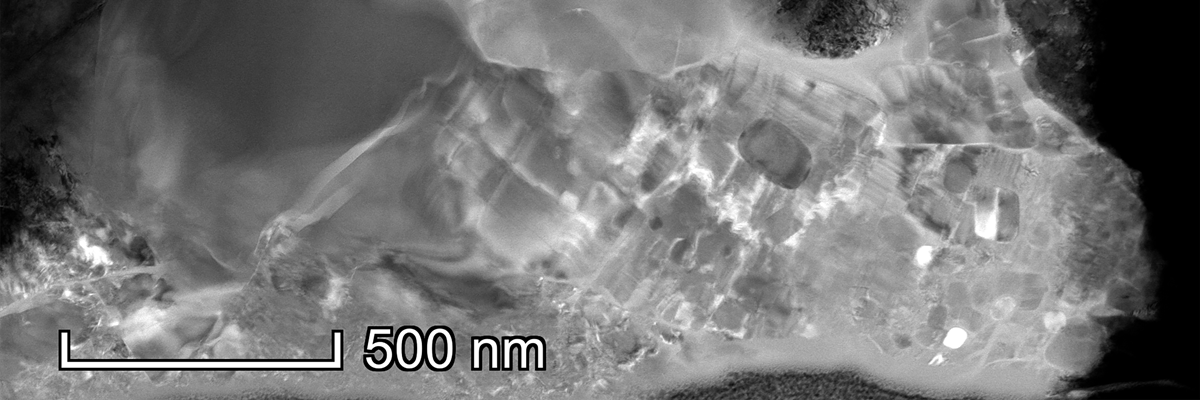
The cohort of microscopy at JdLC covers a wide length scale, from light microscopy to the atomic level analysis by TEM and APT. A wide range of SEM, TEM, FIB and ion-probe microscopy operating with a variety of configurations covers almost all major analytical requirements of corrosion centre’s projects. For electron microscopy, these include nanoscale imaging by secondary electron (SE), backscattered electron (BSE) and cathodoluminescence (CL), and panoramic imaging of these for representing extensive features over a section in real industrial components. Figure 1 shows a fractography of an industrial failed component.
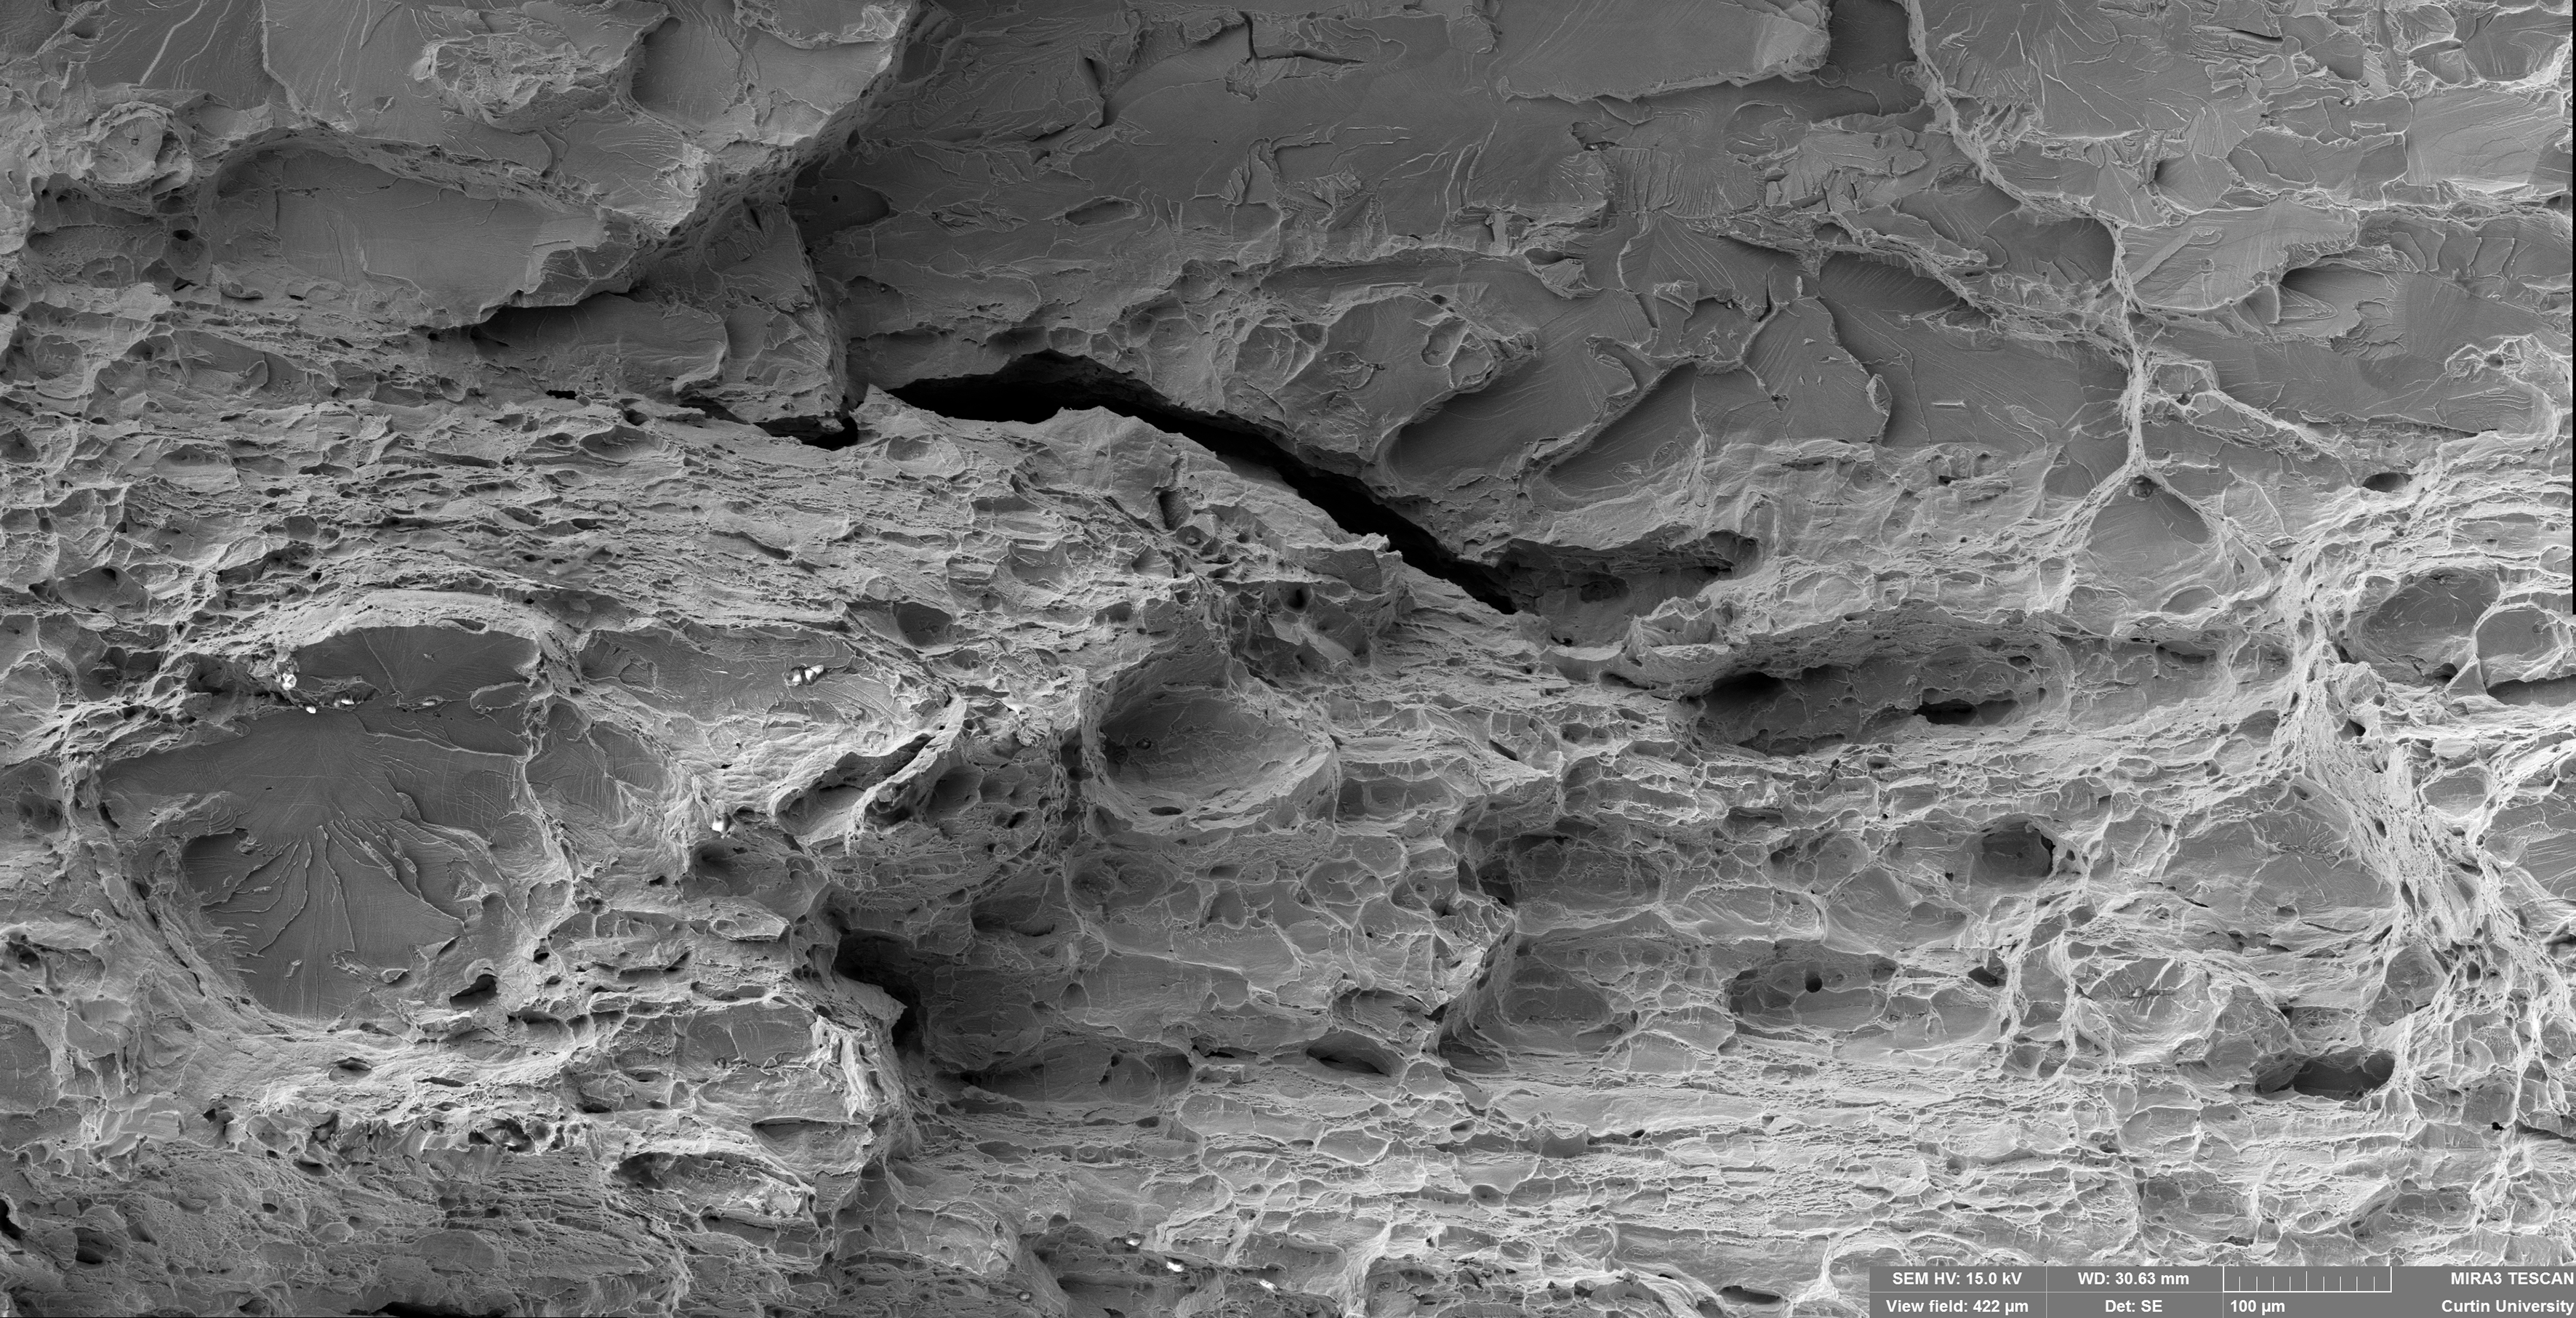
Figure 1; SEM image of a fractured industrial failed 25Cr super duplex stainless steel component.
The TEM can offer up to atomic lattice resolution in two- and three-dimensions. It also has a set of scanning transmission electron microscopy (STEM) detectors and diffraction capabilities. Figure 2 shows the formation of a detrimental phase in precipitation strengthened alloy; this was investigated by lattice resolution TEM imaging, electron diffraction and elemental analysis at the nanoscale. For microanalysis, the centre offers elemental analysis by energy dispersive x-ray spectroscopy (EDS) in both SEM and TEM, light element analysis by Time of Flight Secondary Ion Mass Spectroscopy including depth profiling (ToF SIMS), two- and three-dimensional Electron Back Scattered Diffraction (EBSD) and Transmission Kikuchi Diffraction (TKD).
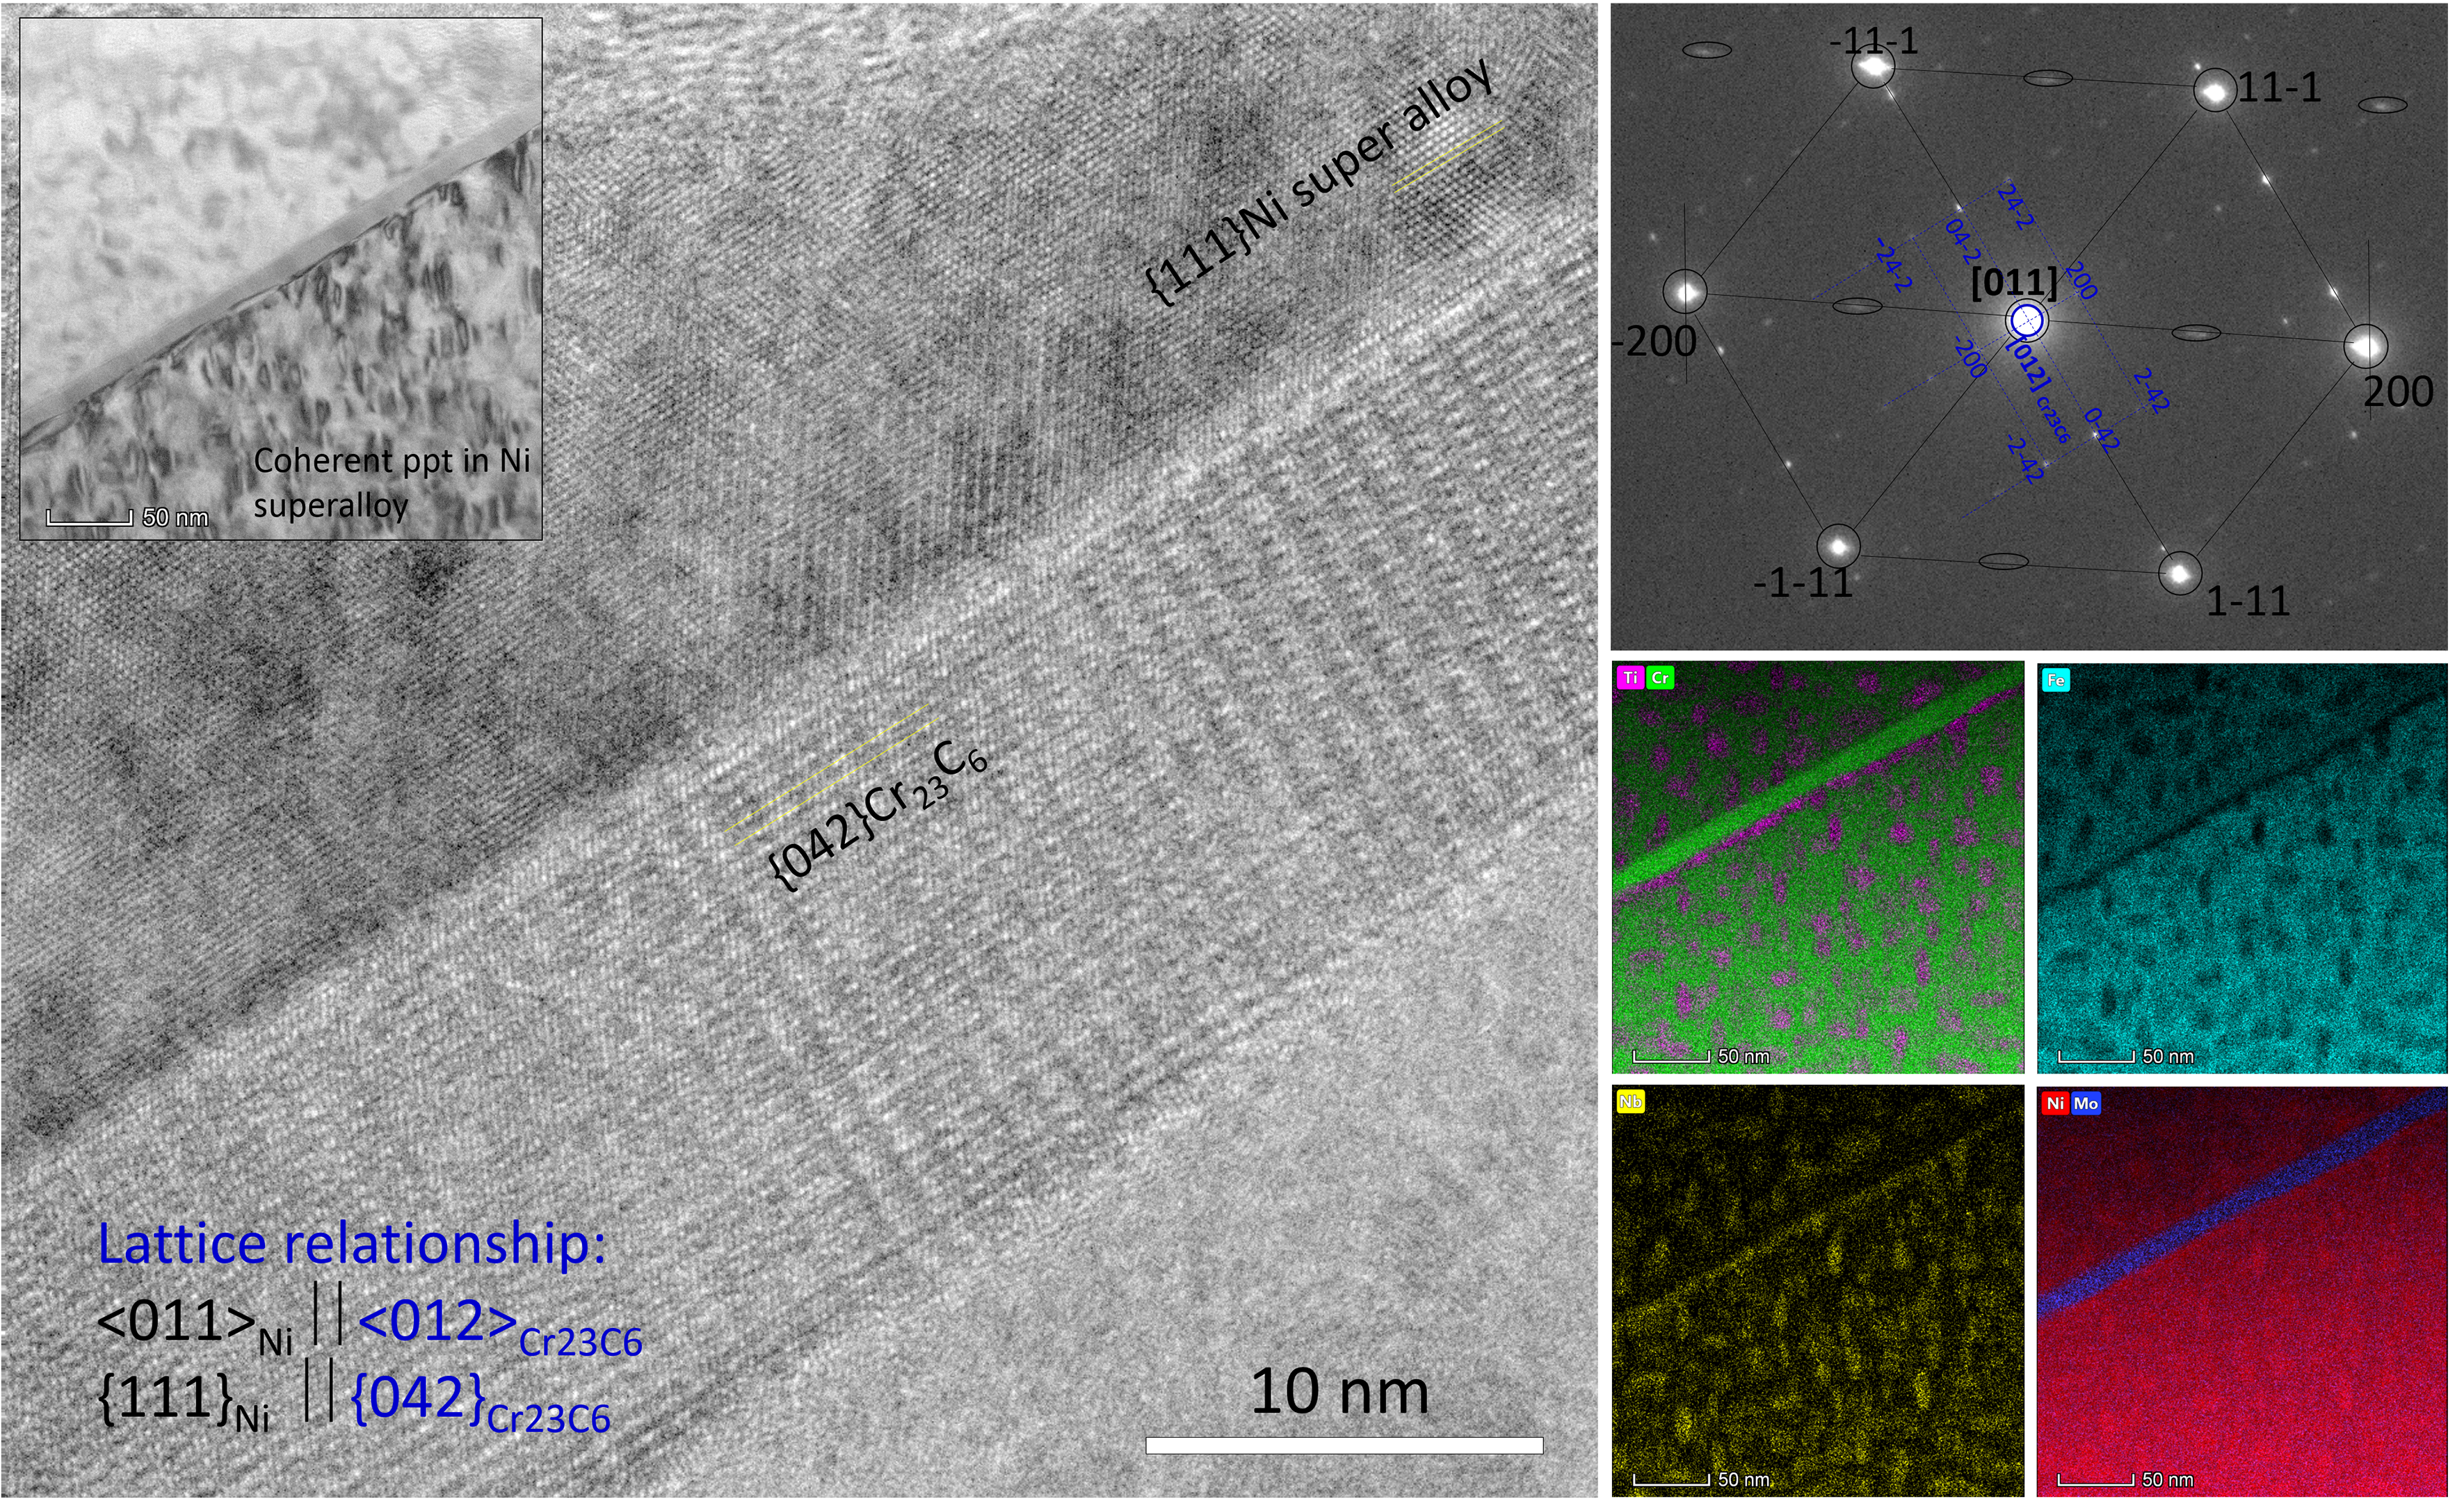
Figure 2; lattice resolution TEM image showing the diffraction and elemental mapping of a grain boundary phase.
The last example is on the effect of Ni content in the phase transformation of low alloy steels. The influence of nickel to the martensite morphology of a research-grade low alloy steel is investigated and an EBSD scan is shown in Figure 3, which shows the colour coded orientation in the Z direction.
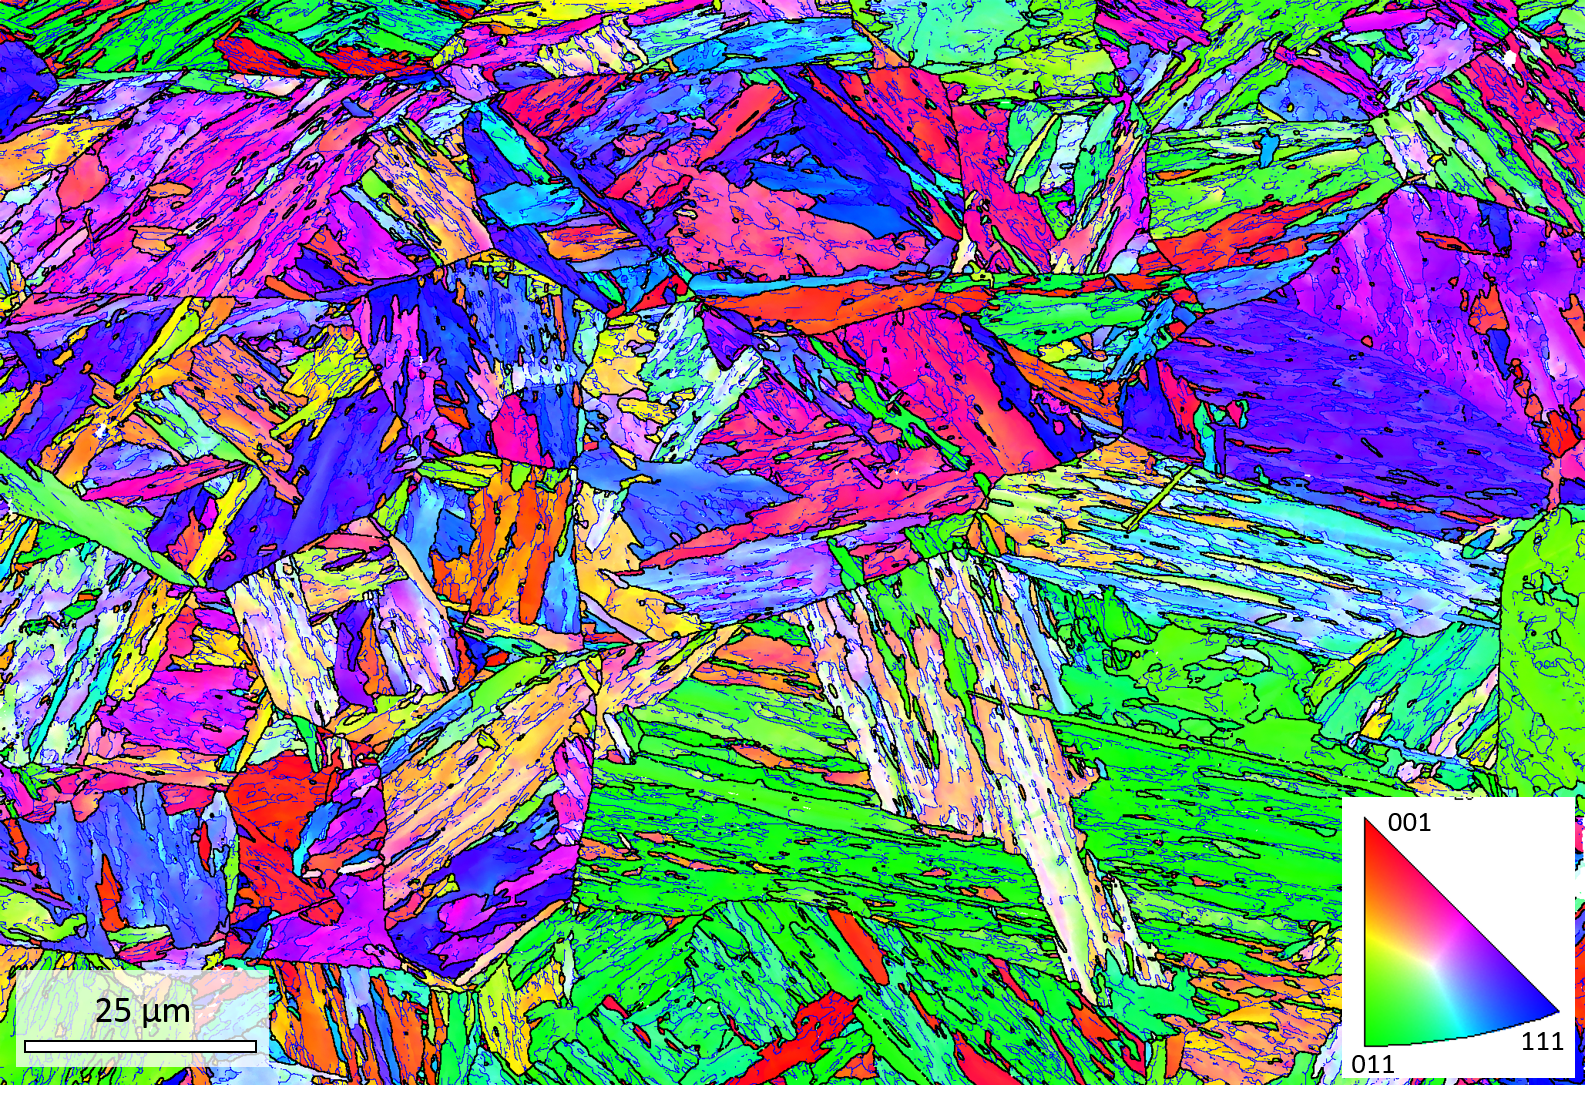
Figure 3; EBSD measured orientation map showing the structural morphology in a project varying Ni content in steel.